 daily dose of Piefke 3000 – in glittery English.")

2016 JavaScript Rising Stars.
2016 is over, you may think you missed something important? Don't worry, we are going to review what were the main trends.
How statistics lost their power – and why we should fear what comes next.
The ability of statistics to accurately represent the world is declining. In its wake, a new age of big data controlled by private companies is taking over – and putting democracy in peril.
A million requests per second with Python.
Is it possible to hit a million requests per second with Python? Probably not until recently.
What The Fuck Just Happened Today? Logging the daily shock and awe. By @matt_kiser
How to unlock your Mi device.
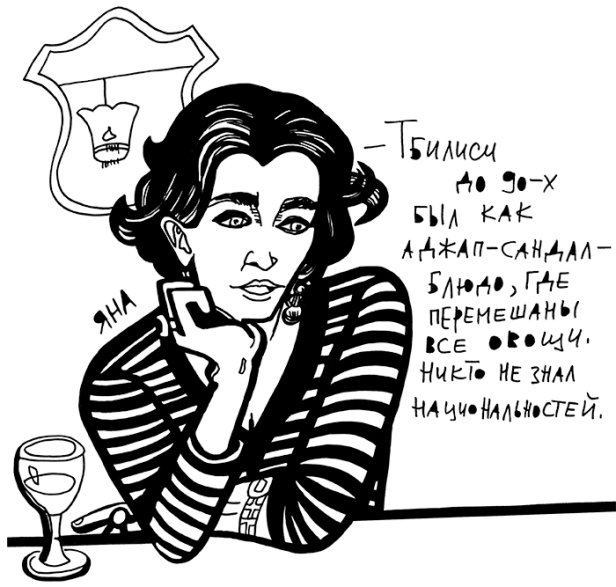
It’s forbidden to be sad in Georgia.
A Complete Beginner's Guide To Blockchain.
Blockchain is a technological innovation that is likely to disrupt not just our financial markets and institutions but will have significant implications for most businesses and industries. Here we provide a simple explanation of what blockchain is and how it works.
Relevant: Blockchain Demo.
Maybe relevant: “Recent data shows that trust in institutions is at a significantly low point (…) Blockchain, and namely Ethereum, can be used as a tool to instill some of that trust back into society.”
After Truth?
Terms like post-truth and post-blackness distort the past and the present.
Post-blackness has retreated from public discourse. And now “post-truth” has become the latest empty idea in search of a meaning. Both obscure the fact that blackness and truth are always under siege.
Crypto protocols that are simple, fast, and secure.
Noise Protocol Framework.
“Inline documentation, why I’m ditching it.”
(This article is from 2011 but as far as I reviewed current tools the state of JavaScript documentation generation remains in a sad state.)